A 3DEP viewshed from Engineer Mountain: the named summits the model rates in view
purespatial.com/articles/engineer-mountain-viewshed-3dep-lidar
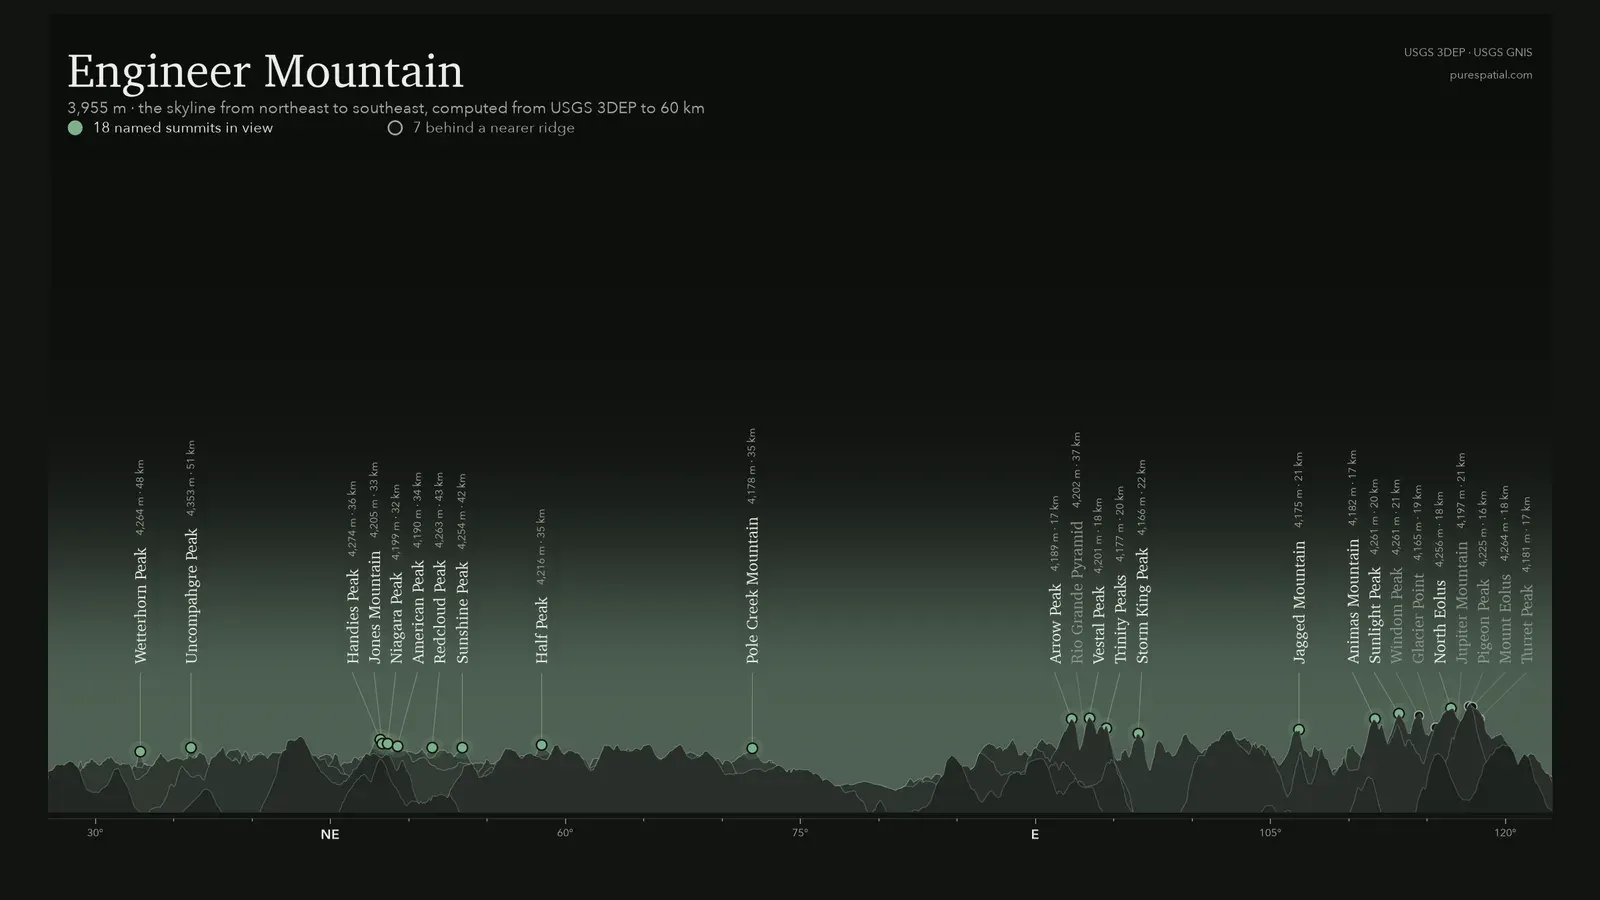
The 3DEP model rates 27 of 40 named summits above 3,600 m in view from the summit, the farthest Uncompahgre Peak at 51 km; I check the list on my next visit.
Why this summit
Engineer Mountain stands alone above Coal Bank Pass on US 550, between Silverton and Durango, and the summit has a view in every direction. I want the list of what is in view from the top, by name and by distance, before I am up there next with a camera.
I check a model against the ground before I publish it. This time the model goes first, in September 2026, and the photographs come on the next visit. Every number below is the elevation model’s, not the ground’s, and the list is what I carry up.
Data
- Product
- Classified lidar point clouds (LAZ) and 1 m bare-earth DEM by project; 1/3 arc-second seamless DEM nationwide
- Resolution
- 1 m DEM where lidar exists (finer in some projects); 10 m seamless
- Cadence
- Project by project; no fixed revisit
- Latency
- Months to years from acquisition to publication, by project
- Format
- GeoTIFF (DEM), LAZ (points), Entwine Point Tiles on AWS
- License
- Public domain (US government work)
- Access
- The National Map downloader; AWS Open Data bucket usgs-lidar-public (EPT); py3dep
- Official
- www.usgs.gov/3d-elevation-program
Method
Two public elevation models from the USGS 3D Elevation Program: the 1/3 arc-second seamless DEM resampled to 30 m for a 60 km far field, and the 1 m lidar bare-earth DEM for a 3 km near field, both projected to UTM zone 13N so distances are in metres. Named summits come from the USGS Geographic Names Information System.
far_dem = ps.dem.fetch_dem(LON, LAT, 60_000, 30, DATA / "dem_30m_60km.tif")
near_dem = ps.dem.fetch_dem(LON, LAT, 3_000, 1, DATA / "dem_1m_3km.tif")
gnis = ps.peaks.load_gnis("CO", DATA)
summit = ps.peaks.find_feature(gnis, "Engineer Mountain", near=(-107.79, 37.70))
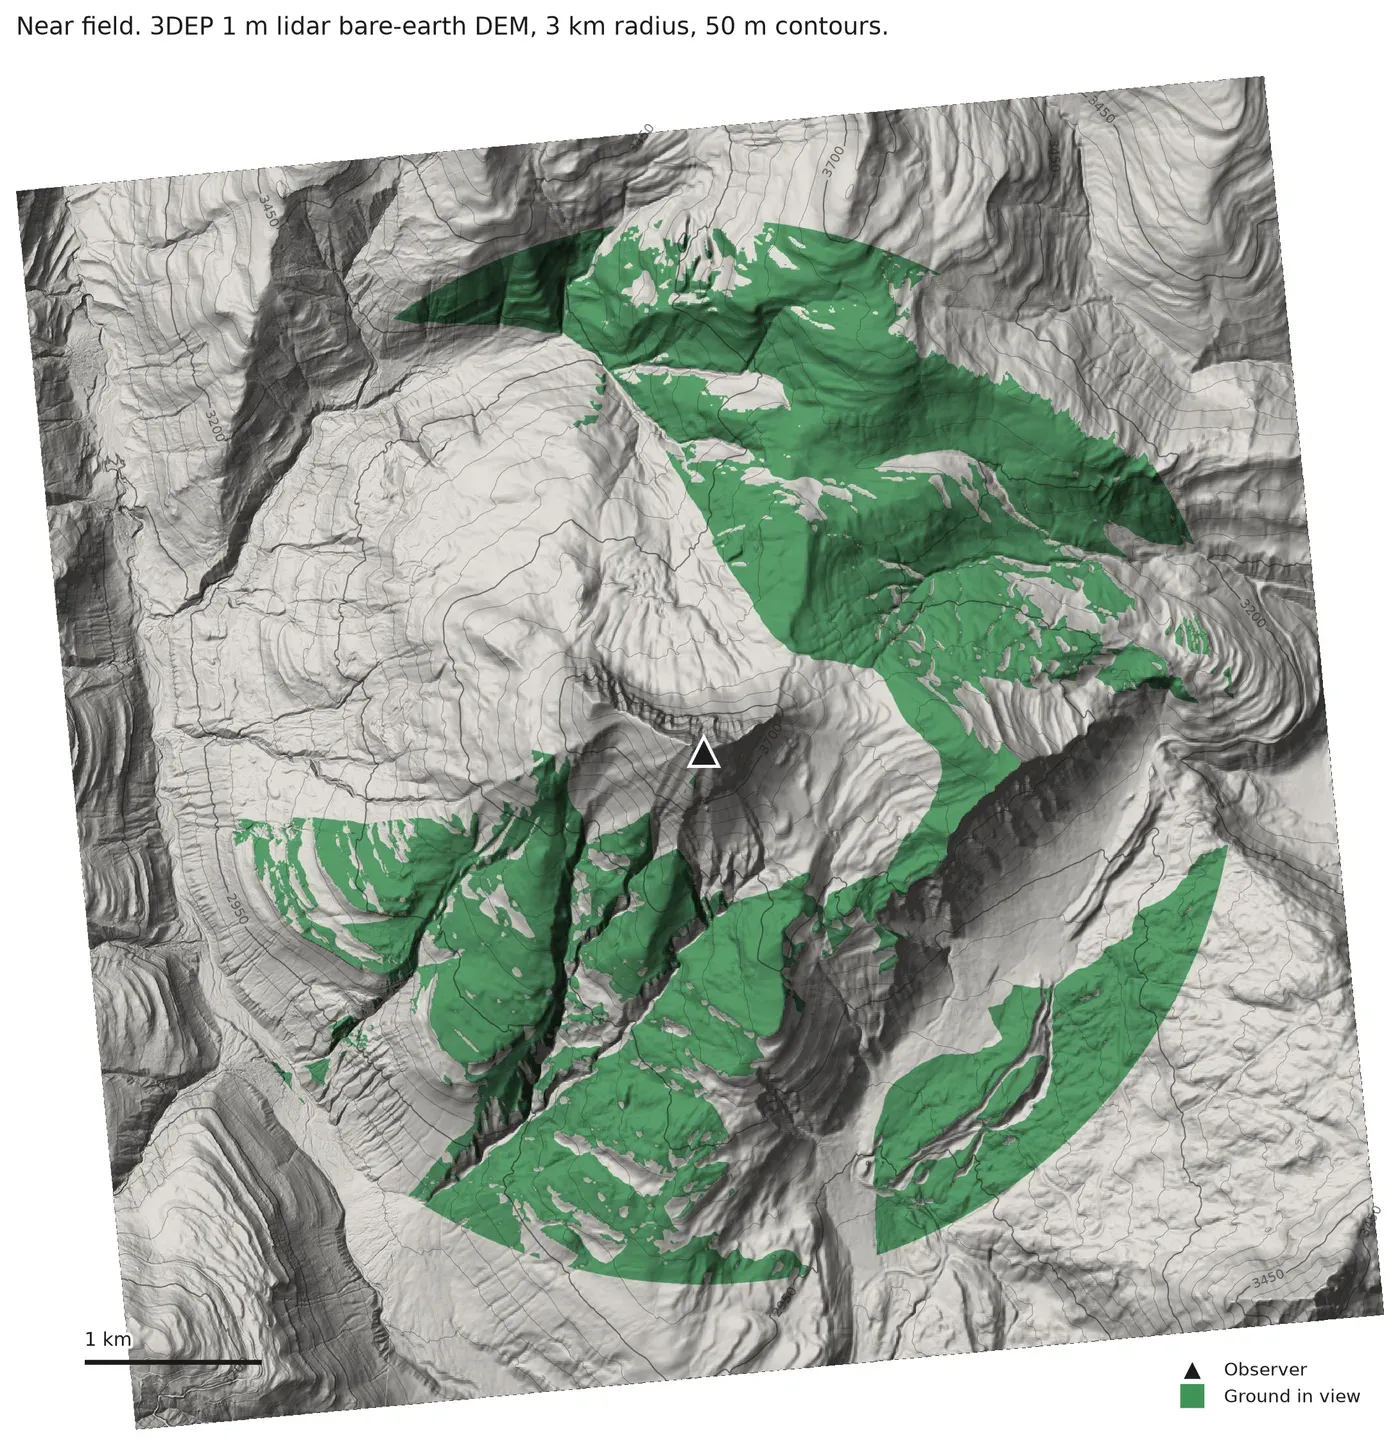
The observer stands on the crest, not on the gazetteer point. GNIS places the summit 20 m from the highest 1 m cell and 10 m below it, and a viewshed run from the gazetteer cell was blind to the north, hidden by the summit itself. The observer moves to the highest 1 m cell within 100 m, and both viewsheds start there.
OBS_LON, OBS_LAT, summit_elev = ps.dem.highest_point(near_dem, LON, LAT, 100)
gdal_viewshed from 1.7 m above that cell, target height 0, curvature coefficient 0.85714 for curvature with standard refraction, cut at 60 km on the far grid and 3 km on the near one.
far_vs = ps.viewshed.run_viewshed(far_dem, OBS_LON, OBS_LAT, DATA / "viewshed_far.tif", observer_height=1.7, max_distance=60_000)
near_vs = ps.viewshed.run_viewshed(near_dem, OBS_LON, OBS_LAT, DATA / "viewshed_near.tif", observer_height=1.7, max_distance=3_000)
Every GNIS summit within 60 km at 3,600 m or higher, the highest forty, each sampled against the far viewshed at its own coordinates and rated visible or hidden.
cand = ps.peaks.summits_near(gnis, OBS_LON, OBS_LAT, max_km=60, min_km=1.0)
cand["elevation_m"] = ps.dem.sample(far_dem, cand["lon"], cand["lat"])
cand = cand[cand["elevation_m"] >= 3600].sort_values("elevation_m", ascending=False).head(40)
cand["predicted"] = np.where(ps.dem.sample(far_vs, cand["lon"], cand["lat"]) >= 128, "visible", "hidden")
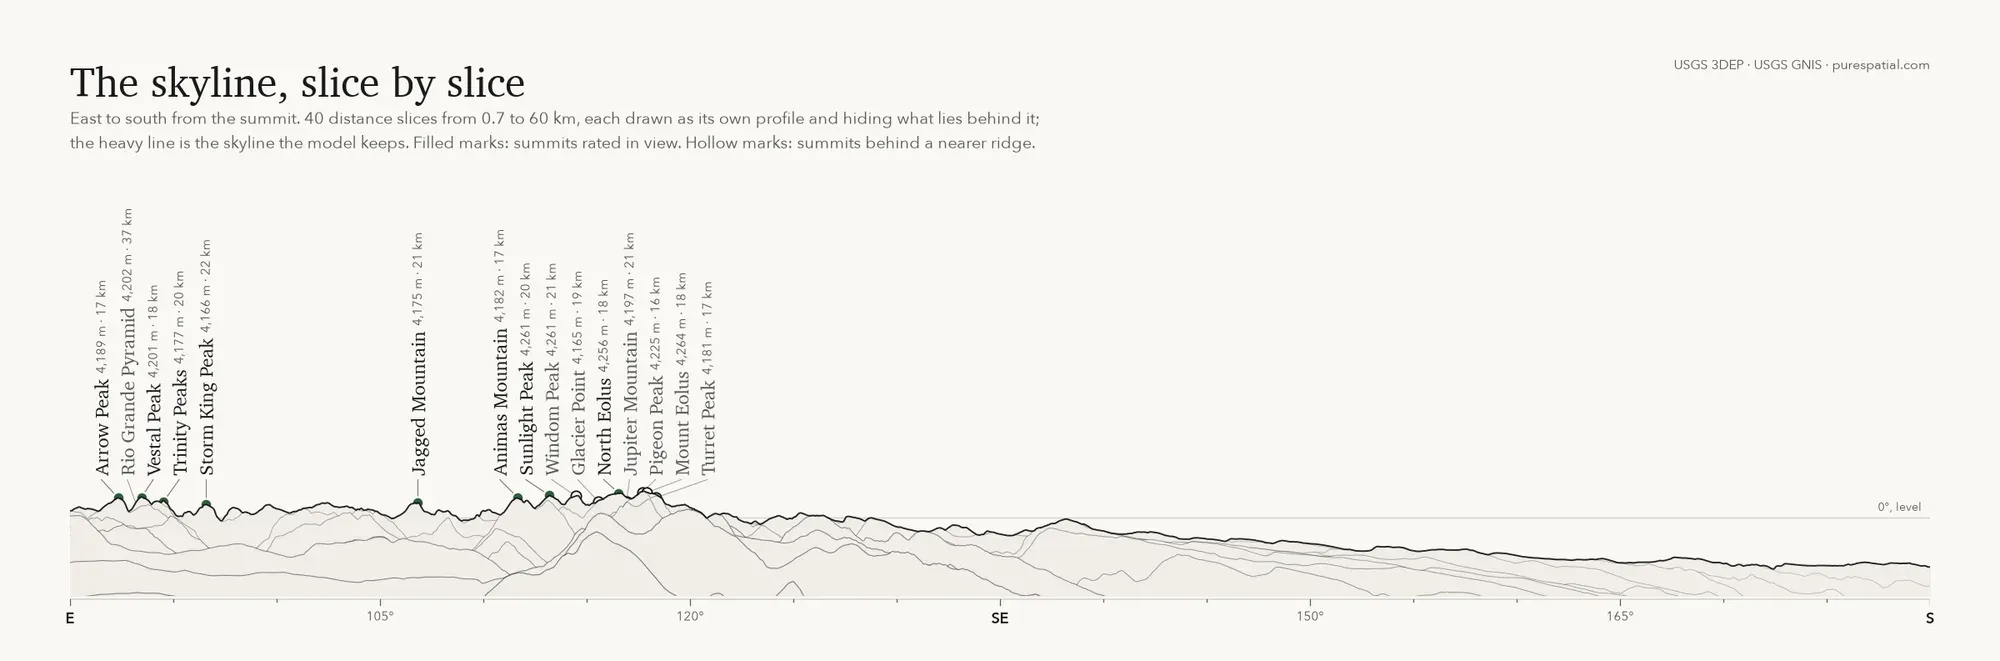
The skyline itself is cast from the same observer: a ray every 0.05 degrees of true azimuth, the DEM sampled every 30 m out to 60 km with the same curvature, the eye 1.7 m above the 1 m crest. The largest elevation angle along a ray is the skyline. Drawing distance slices far to near, each hiding what lies behind it, gives the ridges in view; a summit rated visible stands on the skyline, and a summit rated hidden falls inside the ridge in front of it.
sky = ps.panorama.compute_skyline(far_dem, OBS_LON, OBS_LAT, observer_height=1.7, max_distance=60_000, observer_elevation=summit_elev)
Result
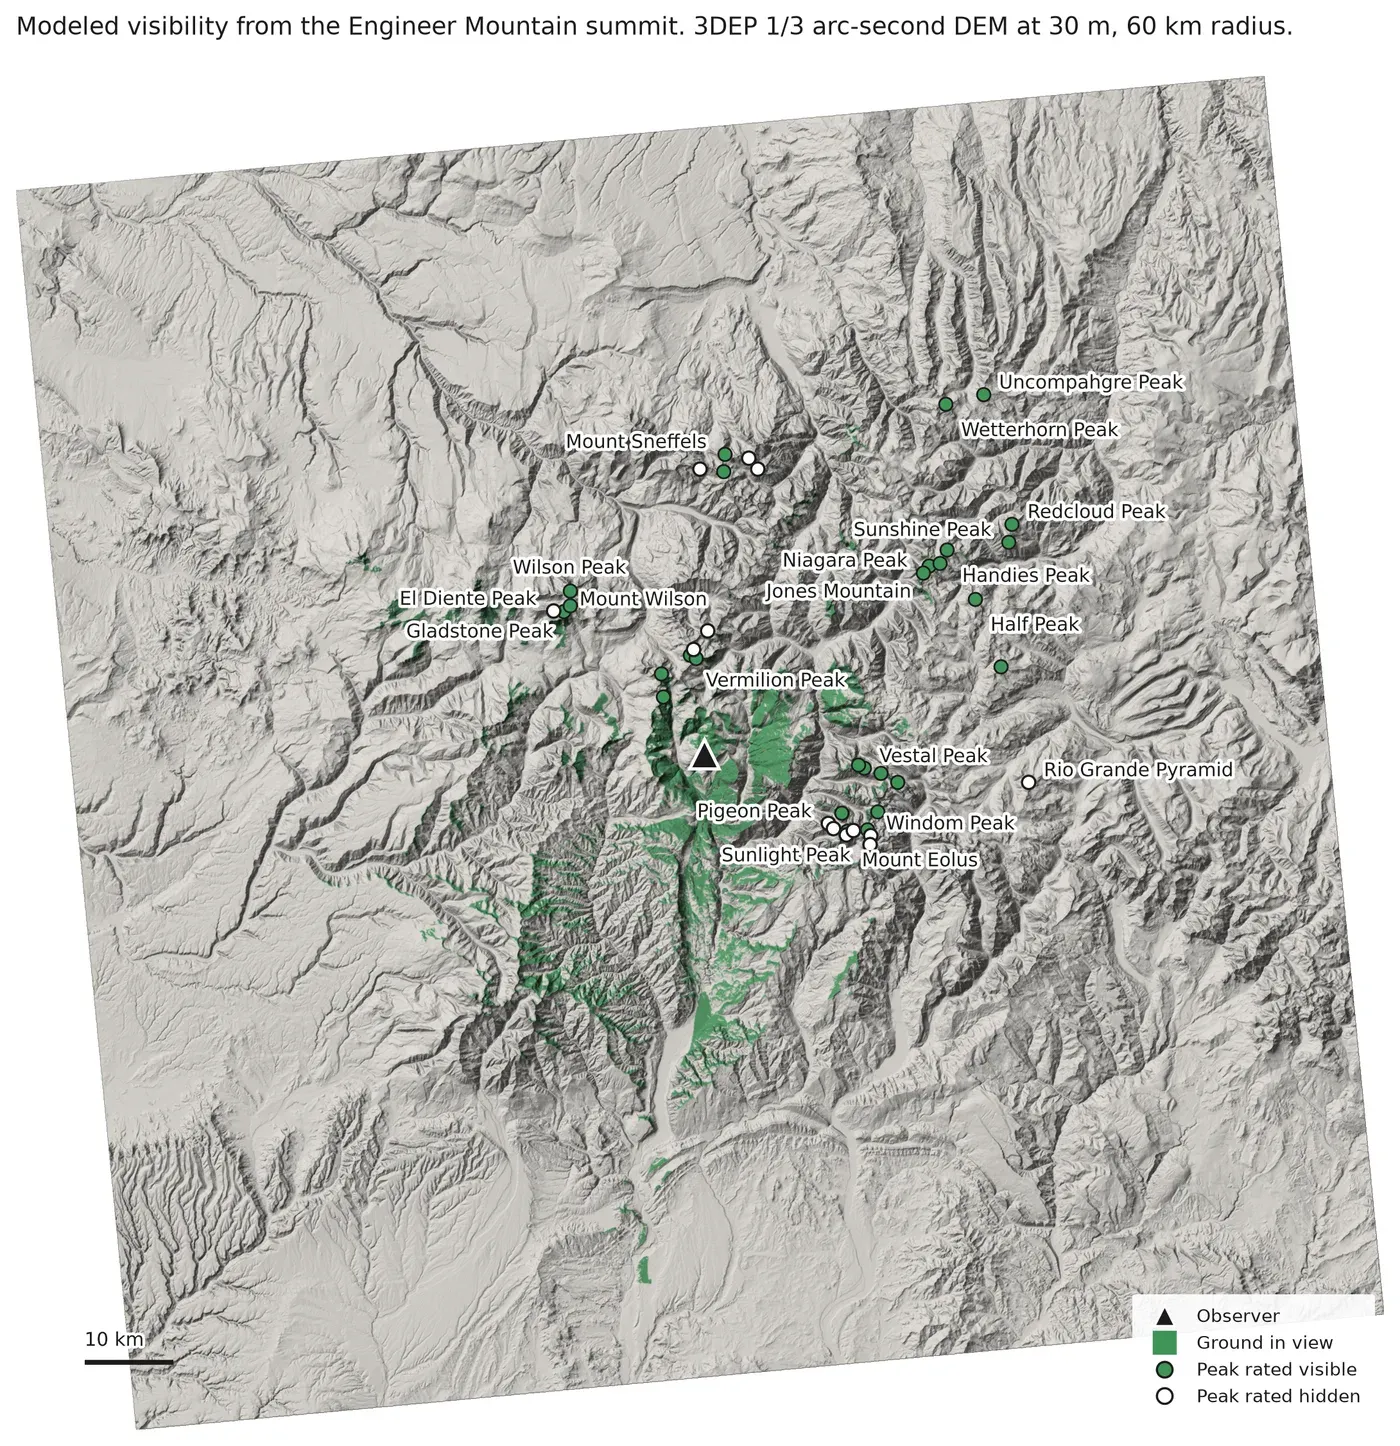
The model rates 27 of the 40 named summits in view and 13 hidden. The farthest in view is Uncompahgre Peak at 51 km, with Wetterhorn Peak beside it at 48 km. Ground in view covers 3.1 percent of the 60 km far field and 30.2 percent of the 3 km near field: from a summit the eye lands on ridgelines, and everything behind them is out of sight.
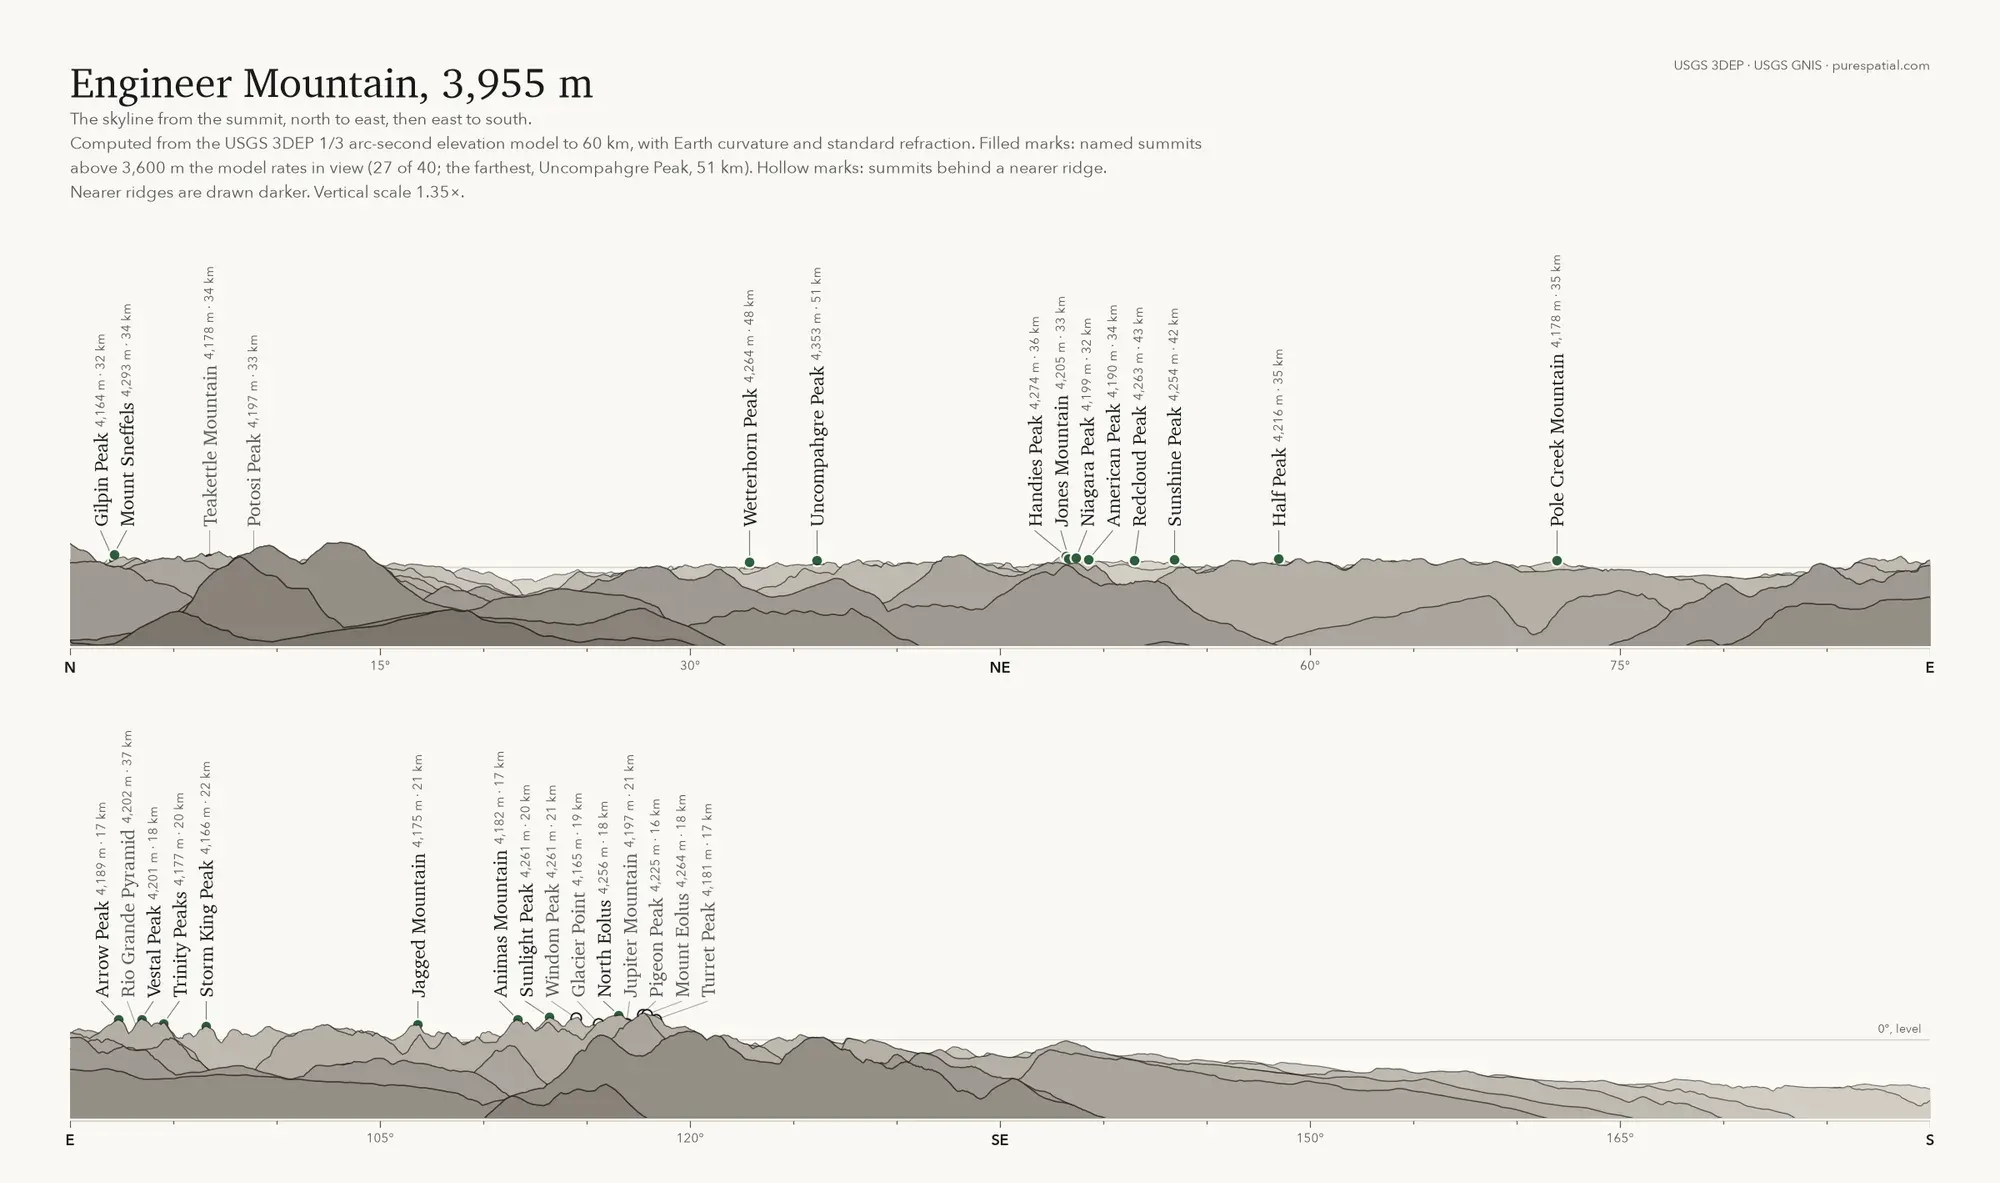
East. The Grenadiers, Arrow Peak, Vestal Peak, Trinity Peaks, and Storm King Peak, stand on the skyline between 92 and 97 degrees at 17 to 22 km, and Jagged Mountain at 107. In the Needles, Sunlight Peak and North Eolus stand clear; Windom Peak, Mount Eolus, Pigeon Peak, Turret Peak, Jupiter Mountain, and Glacier Point are rated hidden, six summits within five degrees of bearing whose marks fall just inside the ridge in front of them on the sheet. Rio Grande Pyramid, at 37 km on the same bearing as the Grenadiers, is rated hidden; its mark sits inside the Grenadier ridge.
North. Mount Sneffels and Gilpin Peak stand up at 34 and 32 km; Teakettle Mountain and Potosi Peak beside them are rated hidden. Uncompahgre Peak and Wetterhorn Peak are in view at 51 and 48 km, and the Handies group, Handies, Jones, Niagara, American, Redcloud, Sunshine, and Half Peak, runs along the skyline between 48 and 58 degrees at 32 to 43 km.
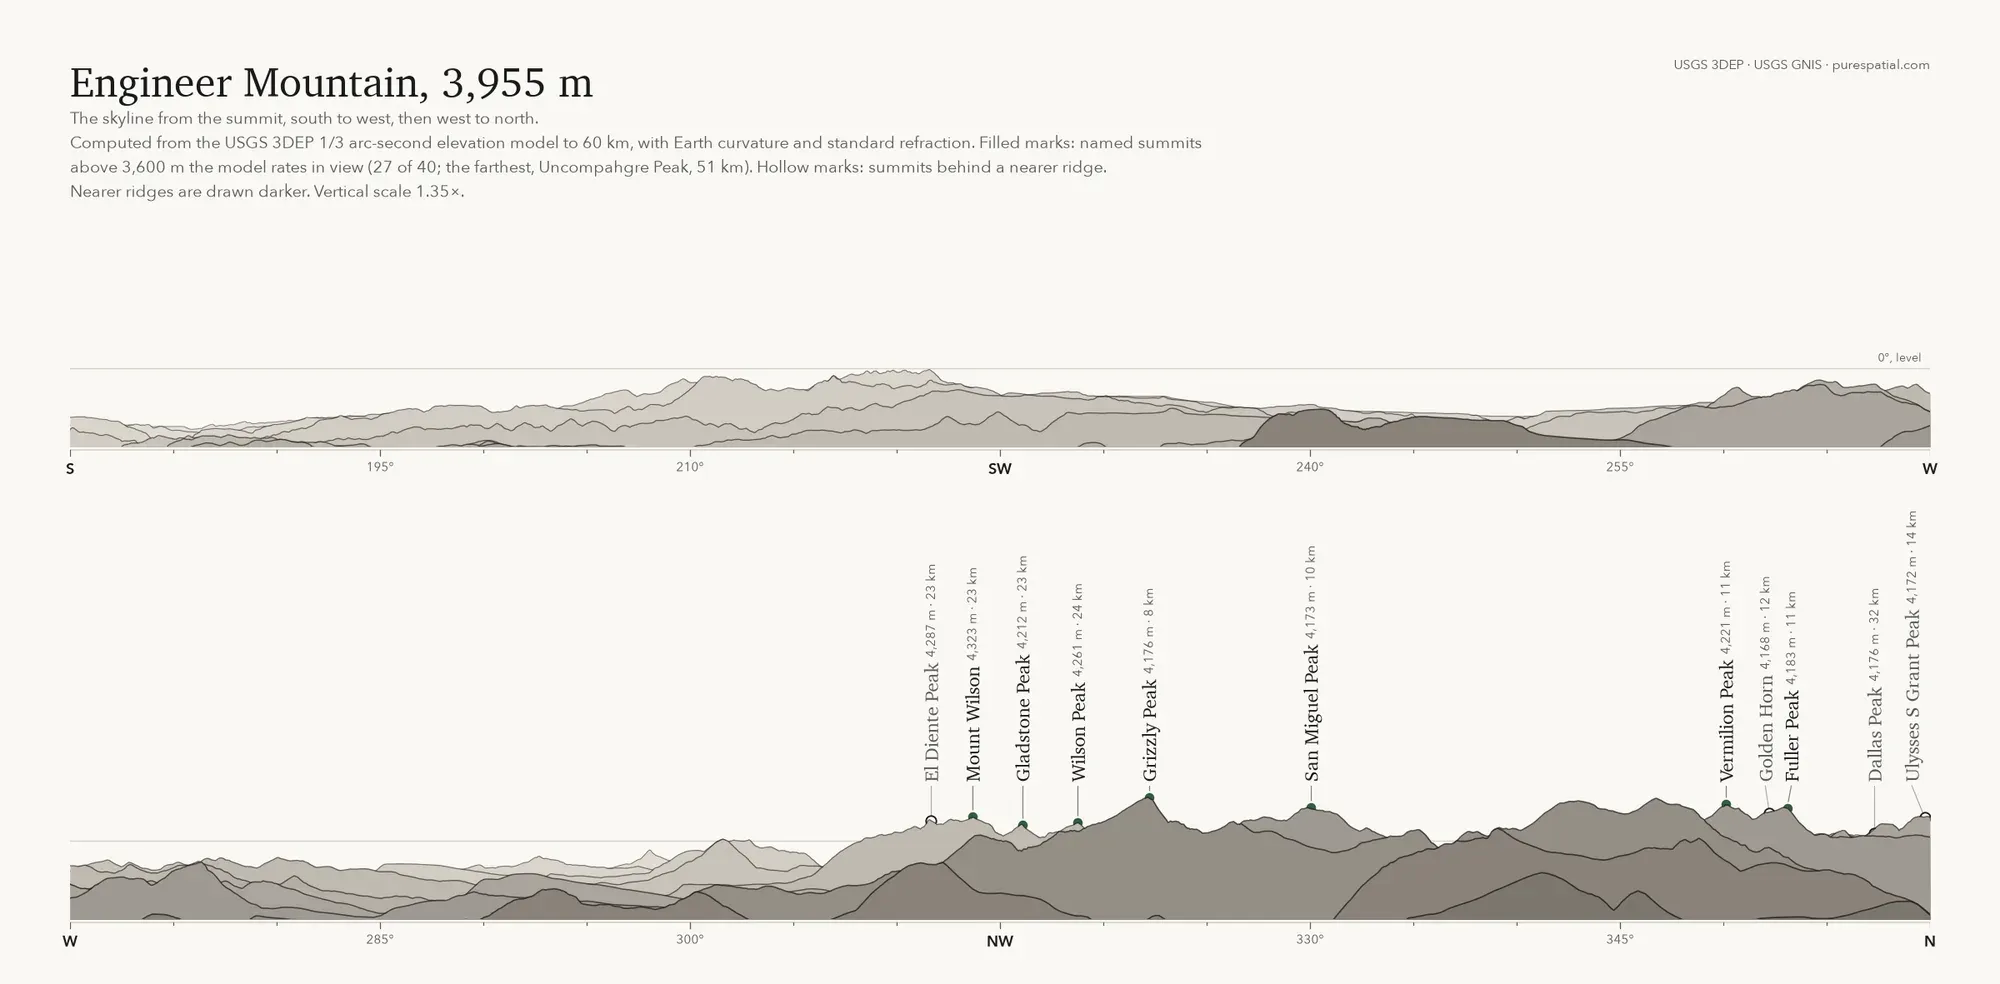
Northwest and north. Mount Wilson, Gladstone Peak, and Wilson Peak are in view at 23 to 24 km; El Diente Peak, a kilometre farther on almost the same bearing, is rated hidden. Grizzly Peak at 8 km is the highest point on the whole skyline. Vermilion Peak and Fuller Peak stand up at 11 km with Golden Horn between them rated hidden, and Dallas Peak at 32 km and Ulysses S Grant Peak at 14 km, both due north, are rated hidden. South. Nothing above 3,600 m, and the horizon sits below level across the whole quarter-turn.
Where the model is likely wrong, until I check
I have not checked this list against the ground. Two things the run itself shows.
The bare-earth model has no trees. Engineer Mountain’s summit is above treeline, but the slopes and ridges in the near field are not, and a camera on the summit sees canopy where the model sees ground. Near ridgelines below treeline will be rated visible when they are not.
The coarse grid loses the summit. The 30 m DEM puts the summit at 3,947 m; the 1 m lidar puts the crest at 3,955 m. A viewshed started from the GNIS coordinate, 20 m from the crest and 10 m below it, saw nothing to the north because the summit hid it. Any viewshed from a named summit on a 10 m or 30 m grid should start from the highest fine-grid cell, not from the gazetteer point.
The check is set up. In the notebook folder, field/observations.csv carries one row per summit with the model’s rating. On the next visit I mark each one visible or hidden from the photographs, re-run, and the score replaces this section.
- 3DEP lidar: The bare-earth DEM removes the trees, so a viewshed from a summit near treeline over-reports what a camera sees below the ridgelines.
- 3DEP lidar: The 1/3 arc-second grid puts the summit 8 m below the 1 m lidar crest, and a viewshed started from the gazetteer coordinate, 20 m off the crest, saw nothing to the north; the observer has to stand on the highest 1 m cell.
Reproduce
The notebook fetches both DEMs and the GNIS names, runs gdal_viewshed, rates the forty summits, draws the sheets and the hero, and writes result.json. Public data and open tools; a re-run takes under a minute once the downloads are cached.

Jesse Sprague. Field-checked analyses of public wildfire data. Work: Echospectra.
purespatial.com/articles/engineer-mountain-viewshed-3dep-lidar